Comparing Models & Sensitivities
This page covers how to select and compare historical run datetimes, overlay multiple models on the same chart, view sensitivity scenarios, and display input aggregations alongside your forecast.
Run Datetimes
The options sidebar lists historical model run datetimes, sorted most recent first. Select up to 4 run datetimes simultaneously to compare how the forecast has evolved across runs.
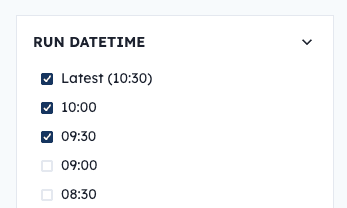
Hover over a run datetime to reveal the Explore run data icon — clicking it opens the Data Explorer with that run’s complete input and output data.
![]()
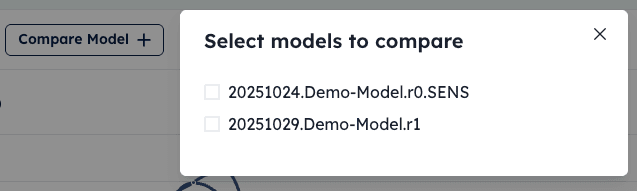
Model Comparison
To compare models:
- Click the Compare Model button in the sub-navigation bar.
- In the modal, select one or more models using the checkboxes. The list shows models that share the same time horizon as your current model.
- Close the modal. The selected models are now overlaid on the forecast chart and table.
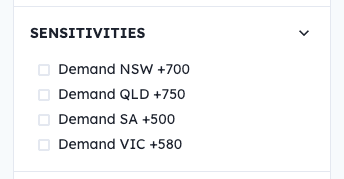
Sensitivities
Sensitivities are alternative “what if” runs of your model. Each sensitivity applies modified assumptions to the input data and produces a separate forecast for the same run datetime.
To view sensitivity scenarios:
- Open the options sidebar by clicking the options icon in the sub-navigation bar.
- Expand the Sensitivities section.
- Check one or more sensitivities. Their forecast data is overlaid on the chart alongside the base case.
To learn how to configure sensitivities as a model author, see Sensitivities.
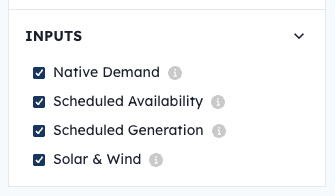
Input Aggregations
To display input aggregations:
- Open the options sidebar and expand the Inputs section.
- Check one or more input aggregations. Hover over the info icon next to an aggregation to see a description of what it represents.
- The selected aggregation data appears as time-series lines below the main forecast chart.
Next Steps
To review how your model performs against actuals over time, see Performance Metrics. To dig into the raw data behind any run, see Exploring Data with SQL.