Overview
The pd4castr UI is where you view and interact with published forecast models. You can compare models and sensitivity scenarios, review performance metrics, explore raw data with SQL, and monitor model runs.
Getting Started
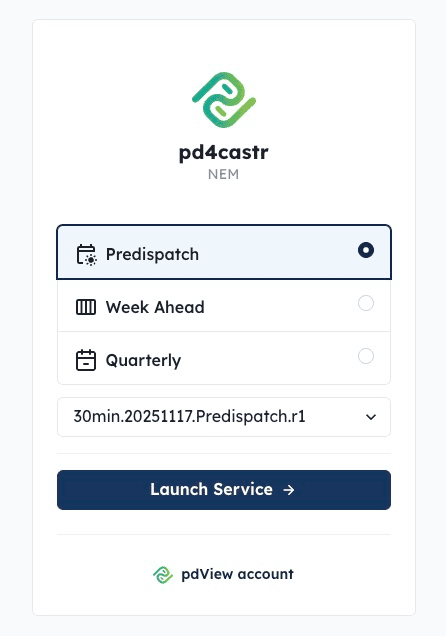
After logging in, select a time horizon and model from the dropdown, then click Launch Service to open the forecast dashboard.
If you’re new to the platform, click Run Walkthrough in the top navigation bar to launch an interactive tour.
Next Steps
- Comparing Models & Sensitivities — compare forecasts, view sensitivities, and select run datetimes.
- Performance Metrics — analyse model accuracy over time.
- Exploring Data with SQL — query raw model data in the browser.
- Author Tools — monitor model runs and debug failures.